Posts

Showing posts from March, 2022

BOEING CO. PRICE AND FORECAST - CAPITAL STREET FX

Image
  BOEING CO. Technical Analysis: Weekly Chart In the weekly charts, BOEING CO. is trading in a down channel. It is trading below all SMA. The immediate support is 187.20 & the resistance level is at 200.77. BOEING CO. is trading in the down channel until there is trend reversal. CLICK HERE FOR FULL REPORT

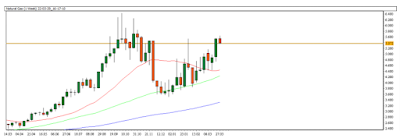
NATURAL GAS PRICE & FORECAST BY CAPITAL STREET FX

Image
  In the weekly charts, Natural Gas is trading in an upward channel. Natural Gas is near its crucial support of 20-days SMA. If it breaks this support, it will possibly test the 50-days SMA level. Natural Gas will follow an uptrend in the coming weeks. The Natural Gas crucial support level is at 4.334 which is near 20 days SMA as of now. There are no signs of a bearish trend. Natural Gas is trading Above All the moving averages.RSI which is 60.40 Suggest Natural Gas  to move in  a Positive  Direction Bulls have their tight grip on Natural Gas. CLICK HERE FOR FULL REPORT

NVIDIA CORP WEEKLY TECHNICAL ANALYSIS – 24 MARCH 2022

Image
  NVIDIA CORP. Technical Analysis: Weekly Chart In the weekly charts, NVIDIA CORP. was trading in a down channel. It is trading below 20 days SMA & above 50 and 100 days SMA. The immediate support is 230.09 & the resistance level is at 271.42. NVIDIA CORP. was trading in the down channel before the breakout upside. NVIDIA CORP. Technical Analysis: Daily Chart READ FULL REPORT - CLICK HERE

TWITTER WEEKLY PRICE CHART AND FORECAST – CAPITAL STREET FX

Image
  TWITTER Technical Analysis: Weekly Chart In the weekly charts, TWITTER is trading in a down channel. It is trading below all SMA. The immediate support is 31.93 & the resistance level is at 41.62. TWITTER is trading in the down channel until there is a trend reversal. TWITTER Technical Analysis: Daily Chart READ FULL REPORT - CLICK HERE

S&P 500 STOCK PRICE AND FORECAST BY CAPITAL STREET FX

Image
  S&P 500 PRICE TECHNICAL ANALYSIS: WEEKLY CHART In the weekly charts, S&P 500 is trading in a downward channel. S&P 500 is near its crucial support of 20-days SMA. If it breaks this support, it will possibly test the 50-days SMA level. S&P 500 will follow a downward trend in the coming weeks. The  S&P 500 crucial support level is at 4,584.90  S&P 500  which is near 20 days SMA as of now. There are no signs of a Bullish trend. Bears have their tight grip on  S&P 500. READ FULL REPORT - CLICK HERE

TESLA WEEKLY PRICE AND FORECAST – CAPITAL STREET FX

Image
  TESLA Technical Analysis: Weekly Chart In the weekly charts, TESLA is trading in a down channel. It is trading above 50 and 100 days SMA & below 20 days SMA. The immediate support is 758.43 & the resistance level is at 879.09. TESLA is trading in the down channel until there is a trend reversal. TESLA Technical Analysis: Daily Chart Read full report - Click here

ROYAL DUTCH SHELL PRICE AND FORECAST – 16 MARCH 2022

Image
  ROYAL DUTCH SHELL Technical Analysis: Weekly Chart In the weekly charts, ROYAL DUTCH SHELL is trading in an up channel. It is trading above all SMA. The immediate support is 21.27 & the resistance level is at 23.35. ROYAL DUTCH SHELL is trading in the up channel until there is a trend reversal. ROYAL DUTCH SHELL Technical Analysis: Daily Chart CLICK HERE FOR FULL REPORT

Pfizer weekly technical analysis - 14 MARCH 2022

Image
  PFIZER INC. Technical Analysis: Weekly Chart In the weekly charts, PFIZER INC. is trading in the up channel. It is trading below 20 days SMA & above 50 and 100 days SMA. The immediate support is 47.02 & the resistance level is at 51.87. PFIZER INC. is trading in the up channel until there is a trend reversal. PFIZER INC. Technical Analysis: Daily Chart CLICK HERE FOR FULL REPORT

FORD MOTOR CO. PRICE AND FORECAST – CAPITAL STREET FX

Image
  FORD MOTOR CO. Technical Analysis: Weekly Chart In the weekly charts, FORD MOTOR CO. is trading in the up channel. It is trading above 50 and 100 days SMA & below 20 days SMA. The immediate support is 15.44 & the resistance level is at 17.03. FORD MOTOR CO. is trading in the up channel until there is a trend reversal. FORD MOTOR CO. Technical Analysis: Daily Chart CLICK HERE FOR FULL REPORT

BITCOIN TECHNICAL ANALYSIS & SIGNALS - CAPITAL STREET FX

Image
  BITCOIN PRICE TECHNICAL ANALYSIS: WEEKLY CHART In the weekly charts, Bitcoin is trading in a downward channel. Bitcoin is near its crucial support of 20-days SMA. If it breaks this support, it will possibly test the 50-days SMA level. Bitcoin will follow a downtrend in the coming weeks. Bitcoin’s crucial resistance level is at 51,994.80 which is near 20 days SMA as of now. There are no signs of a bullish trend. CLICK HERE FOR FULL REPORT

CITIGROUP INC WEEKLY TECHNICAL ANALYSIS – 08 MARCH 2022

Image
  CITI GROUP INC. Technical Analysis: Weekly Chart In the weekly charts, CITI GROUP INC. is trading in the down channel. It is trading below all SMA. The immediate support is 53.68 & the resistance level is at 57.28. CITI GROUP INC. is trading in the down channel until there is a trend reversal. CITI GROUP INC. Technical Analysis: Daily Chart CLICK HERE FOR FULL REPORT

CAC 40 WEEKLY TECHNICAL ANALYSIS – MARCH 04, 2022

Image
  CAC 40 Price Technical Analysis: Weekly Chart In the weekly charts ,  CAC 40 40 is trading in a downward channel. CAC 40 is near its crucial support of 20-days SMA. If it breaks this support, it will possibly test the 50-days SMA level. CAC 40 will follow a downward trend in the coming weeks. The  CAC 40 crucial support level is at 7,001.8  CAC 40  which is near 20 days SMA as of now. There are no signs of a Bullish trend. Bears have their tight grip on  CAC 40  . Click Here For Full Report

What to Expect in the Markets This Week - 7 March to 13 March 2022

Image
  EURO ZONE MARGINAL LENDING FACILITY RATE  WHEN:                                                                WHAT IT INFLUENCES: 10th  March 2022                                         EUR  and its subsequent                                                                              pairs WHAT’S HAPPENING : The rate on the marginal lending facility, which offers overnight credit to banks from the Eurosystem. This is one of the key interest rates for the euro area the Governing Council of the ECB sets. U.S. CRUDE OIL INVENTORIES WHEN:                                                                   WHAT IT INFLUENCES: 9th  March   2022                                       USD   and its subsequent                                                                              pairs WHAT’S HAPPENING :   The Energy Information Administration’s (EIA) Crude Oil Inventories measures the weekly change in the number of barrels of commercial crude oil held by US firms. The level of invento

CAC 40 WEEKLY TECHNICAL ANALYSIS BY CAPITAL STREET FX

Image
  CAC 40 Price Technical Analysis: Weekly Chart In the weekly charts ,  CAC 40 40 is trading in a downward channel. CAC 40 is near its crucial support of 20-days SMA. If it breaks this support, it will possibly test the 50-days SMA level. CAC 40 will follow a downward trend in the coming weeks. READ FULL REPORT - CLICK HERE

Day Trading Guide - Best Stocks to Buy Today - March 04, 2022

Image
  TOP 5 STOCKS TO WATCHOUT:- 1.HYUNDAI :     South Korea’s Hyundai Motor Co said on Friday it has not decided when to resume operations at its assembly plant in St Petersburg, Russia, citing ongoing issues with components delivery. “Hyundai Motor Company is deeply concerned by the situation in Ukraine. We can confirm operations of the Hyundai Motor Manufacturing Russia (HMMR) are suspended until further notice due to ongoing global logistics issues with components delivery,” it said in a statement to Reuters. “The safety of our employees and caring for our customers remains the utmost priority of Hyundai Motor. We sincerely hope the situation is resolved peacefully as soon as possible,” it added. Operations at the St Petersburg plant have been suspended since March 1. The South Korean automaker, which together with affiliate Kia Corp is among the world’s top 10 biggest automakers by sales, builds about 200,000 vehicles per year in Russia, about 4% of its global production capacity. Glo
GENERAL MOTORS STOCK PRICE CHART AND FORECAST - TECHNICAL ANALYSIS BY CSFX

Image
  GENERAL MOTORS Technical Analysis: Weekly Chart In the weekly charts, GENERAL MOTORS was trading in the up channel. It is trading below 20 and 50 days SMA & above 100 days SMA. The immediate support is 44.09 & the resistance level is at 48.36. GENERAL MOTORS was trading in the up channel before the breakout. GENERAL MOTORS Technical Analysis: Daily Chart READ FULL REPORT - CLICK HERE

SILVER PRICE CHART AND FORECAST - TECHNICAL ANALYSIS BY CSFX

Image
  SILVER PRICE TECHNICAL ANALYSIS: WEEKLY CHART In the weekly charts, Silver is trading in an upward channel. Silver is near its crucial support of 20-days SMA. If it breaks this support, it will possibly test the 50-days SMA level. Silver will follow an uptrend in the coming weeks. CLICK HERE FOR FULL REPORT

BITCOIN PRICE CHART AND FORCAST - TECHNICAL ANALYSIS BY CSFX

Image
  BITCOIN PRICE TECHNICAL ANALYSIS: WEEKLY CHART In the weekly charts, BITCOIN is trading in a downward channel. BITCOIN is near its crucial support of 20-days SMA. If it breaks this support, it will possibly test the 50-days SMA level. BITCOIN will follow a downtrend in the coming weeks. READ FULL REPORT - CLICK HERE