Posts

Showing posts with the label daily analysis

DAILY TECHNICAL ANALYSIS REPORT - CAPITAL STREET FX

Image
  TUESDAY CHOPPY SESSION ENDED WALL STREET LOWER Asia-Pacific stocks rose in volatile trading on Wednesday. The Shanghai Composite is down 0.71% at 3,163.67. Overall, the Singapore MSCI is up 1.26% at 298.10. Over in Hong Kong, the Hang Seng Index is up 0.34% at 19,667.00. In Japan, the Nikkei 225 is up 0.14% at 27,710.00, while the Topix index is down 0.13% at 1927.50. South Korea’s Kospi is up 0.89% at 2,461.45. Australia S&P/ASX 200 down 0.32% at 6975.90. Top News of the Day: Wall Street ended lower after a choppy session on Tuesday, with geopolitical tensions flaring after U.S. House of Representatives Speaker Nancy Pelosi visited Taiwan. Pelosi said her trip demonstrated American solidarity with the Chinese-claimed self-ruled island, but China condemned that first such visit in 25 years as a threat to peace and stability Market Summary as per 02/08/2022: European equities Tuesday closing. The DAX futures contract in Germany traded down 0.35% at 13,403.94, CAC 40 futures up...

TECHNICAL ANALYSIS REPORT – 07 JULY 2022

Image
  WALL STREET SEESAW WEDNESDAY BEHIND IT HIGHER CLOSE Asia-Pacific stocks were mostly up on Thursday morning. The Shanghai Composite is up 0.22% at 3,362.23. Overall, the Singapore MSCI is down 0.04% at 285.25. Over in Hong Kong, the Hang Seng Index is up 0.34% at 21,579. In Japan, the Nikkei 225 is up 1.88% at 26,490.00, while the Topix index is up 1.76% at 1881.00. South Korea’s Kospi is up 1.84% at 2,334.27. Australia S&P/ASX 200 up 0.81% at 6648.00. Top News of the Day: Wall Street put a seesaw day behind it to close higher on Wednesday, as investors digested new clues on the U.S. central bank’s approach to rate policy and its inflation fight detailed in the minutes from the latest Federal Reserve meeting. After a brutal selloff in global equity markets in the first half of the year, nervous investors are keeping a close watch on central bank actions as they try to assess the impact of aggressive rate hikes on global growth. Market Summary as per 06/07/2022: European equiti...

NATURAL GAS PRICE & FORECAST BY CAPITAL STREET FX

Image
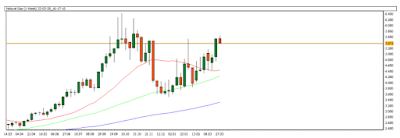
  In the weekly charts, Natural Gas is trading in an upward channel. Natural Gas is near its crucial support of 20-days SMA. If it breaks this support, it will possibly test the 50-days SMA level. Natural Gas will follow an uptrend in the coming weeks. The Natural Gas crucial support level is at 4.334 which is near 20 days SMA as of now. There are no signs of a bearish trend. Natural Gas is trading Above All the moving averages.RSI which is 60.40 Suggest Natural Gas  to move in  a Positive  Direction Bulls have their tight grip on Natural Gas. CLICK HERE FOR FULL REPORT