Posts

Showing posts with the label technical analysis

Today Black Friday Withdrawable Bonus Start Till January 2022

Image
  LIMITED TIME OFFER All our new and existing clients can earn a 900% Instant Deposit Bonus, by simply opening an account with CSFX, and depositing a minimum of $5000 The Bonus is fully tradable and gives 100% draw-down support. Claim Your Instant 900% Bonus, And Start Trading With Us Today Click Here For a Bonus - Visit US

Stock News - APPLE COMPUTER INC. Technical Analysis Forecast

Image
  APPLE WARNS OF LOWER IPHONE SHIPMENTS AS COVID CURBS HOBBLE CHINA PLANT Apple Inc (NASDAQ:AAPL) expects lower shipments of premium iPhone 14 models than previously anticipated following a significant production cut at a virus-blighted plant in China, dampening its sales outlook for the busy year-end holiday season. Demand for high-end smartphones assembled at Foxconn’s Zhengzhou plant has helped Apple remain a bright spot in a technology sector battered by consumer spending cutbacks amid surging inflation and interest rates. But the Cupertino, California-based vendor has fallen victim to China’s zero-COVID-19 policy, which has seen global firms including Canada Goose Holdings (NYSE:GOOS) Inc and Estee Lauder Companies Inc (NYSE:EL) shut local stores and cut forecasts. “The facility is currently operating at significantly reduced capacity,” Apple said on Sunday without detailing the scale of the reduction. “We continue to see strong demand for iPhone 14 Pro and iPhone 14 Pro Max m...

TWITTER TECHNICAL ANALYSIS & MARKET NEWS – TWITTER NEWS

Image
  TWITTER: NEWS & TECHNICAL Twitter agreed to pay whistle-blower $7 million in June compensation settlements Twitter Inc agreed in June to pay $7 million to settle a compensation dispute with the whistle-blower whose allegations will be part of Elon Musk’s case against the company, according to a source familiar with the matter. Whistle-blower Peiter “Mudge” Zatko, who was fired by Twitter (NYSE:TWTR) in January and was the company’s security head, last month accused the social media firm of falsely claiming it had a solid security plan and making misleading statements about its defences against hackers and spam accounts. Zatko will meet the U.S. Senate Judiciary committee on Sept. 13 to discuss the allegations. The settlement resolved a dispute about unpaid compensation and did not prevent him from filing a whistle-blower complaint, which he did soon after reaching the agreement with Twitter, according to the source. Zatko’s attorney said Zatko cannot comment on the existence ...

WEEKLY TECHNICAL ANALYSIS & WEEKLY MARKET STRATEGY – 28 AUGUST 2022

Image
  WEEKLY SNAPSHOT Composite PMI, U.K. WHEN:                                                                 WHAT IT HAD INFLUENCED: 23 rd  AUGUST 2022                                                      GBP and its subsequent pairs WHAT HAPPENED:  The Composite PMI Index measures the activity level of purchasing managers in the both sectors. A reading above 50 indicates expansion in the sector; a reading below 50 indicates contraction. GBPAUD is currently in the downward channel. Further downside can be seen in the coming week. Pending Home Sales (MoM) (Jul), U.S. WHEN:                                ...

TECHNICAL ANALYSIS REPORT – 22 AUGUST 2022

Image
  OIL PRICES FALL AFTER THREE DAYS OF GAINING LEAGUE Asian Pacific shares slipped on Monday. The Shanghai Composite is up 0.57% at 3,276.76. Overall, the Singapore MSCI is up 0.17% at 296.00. Over in Hong Kong, the Hang Seng Index is down 0.04% at 19,714.00. In Japan, the Nikkei 225 is down 0.76% at 28,710.00, while the Topix index is down 0.38% at 1988.00. South Korea’s Kospi is down 1.21% at 2,462.50. Australia S&P/ASX 200 down 0.95% at 7046.90. Top News of the Day: Oil prices slumped on Monday, ending three days of gains, as investors were concerned aggressive U.S. interest rate hikes will weaken the global economy and dent fuel demand while a strengthening dollar also added to pressure. Both Brent and WTI climbed for a third straight day on Friday, but fell about 1.5% for the week on a stronger dollar and demand fears. Market Summary as per 19/08/2022: European equities Friday closing. The DAX futures contract in Germany traded down 1.12% at 13,544.52, CAC 40 futures down 0...


TECHNICAL ANALYSIS REPORT – 27 JULY 2022

Image
  US FUTURES CLOSED “-VE” AS THE FED INTEREST RATE DECISION IS DUE IN THIS SESSION Asia-Pacific stocks were mixed on Wednesday morning. The Shanghai Composite is up 0.07% at 3,279.64. Overall, the Singapore MSCI is up 0.05% at 293.65. Over in Hong Kong, the  Hang Seng Index  is down 1.06% at 20,665. In Japan, the Nikkei 225 is up 0.40% at 27,760.00, while the Topix index is up 0.18% at 1947.50. South Korea’s Kospi is up 0.11% at 2,415.53. Australia S&P/ASX 200 up 0.23% at 6823.20. Top News of the Day: U.S. stock futures  were trading higher during Tuesday’s evening deals, following a negative close for major benchmark averages as market participants monitor earnings from mega-cap technology companies as well as the Federal Reserve’s latest interest rate decision due later in the session. By 7:15pm ET (11:15pm GMT) Dow Jones Futures were up 0.2%, S&P 500 Futures lifted 0.6%, and Nasdaq 100 Futures gained 1.2%. Market Summary as per 26/07/2022: European equitie...

WEEKLY TECHNICAL ANALYSIS WITH CANDLESTICK CHARTS – 10 JULY 2022

Image
  WEEKLY SNAPSHOT      Composite PMI (Jun), U.K.     WHEN:                                                                  WHAT IT HAD INFLUENCED: 05 th  JULY 2022                                                            GBP and its subsequent pairs WHAT HAPPENED:  The Composite PMI Index measures the activity level of purchasing managers in the both sectors. A reading above 50 indicates expansion in the sector; a reading below 50 indicates contraction. GBPAUD is trading in the down channel. Further dow...

US 30 YR. T-BOND PRICE TECHNICAL ANALYSIS

Image
  US 30 YR. T-BOND PRICE TECHNICAL ANALYSIS: WEEKLY CHART In the weekly charts, US 30 YR. T-BOND is trading in down channel. US 30 YR. T-BOND is currently trading below all SMA. RSI is in selling zone which indicates bearishness. MACD is currently below zero which indicates bearishness. Its immediate support is 137.74 & the resistance level is at 140.76. US 30 YR. T-BOND will trade in down channel until there is trend reversal. US 30 YR. T-BOND PRICE TECHNICAL ANALYSIS: DAILY CHART Click Here For Full Report

What is Technical Analysis? - Capital Street FX

Image
  Technical analysis is a trading discipline that uses statistical trends derived from trading activity, such as price movement and volume, to analyse investments and uncover trading opportunities. Unlike fundamental analysis, which seeks to determine the value of a security based on company performance such as sales and earnings, technical analysis focuses on price and volume. WHAT IS TECHNICAL ANALYSIS? At Capital Street, the Technical Analysis Report is created by analysts having rich experience in the global securities market. Their experience in technical and fundamental analysis will help you in generating profit with the safety of funds. Capital Street have immense options in the different script to trade on market simply using your mobile application, computer application or web login. WHAT ARE THE BENEFITS OF TECHNICAL ANALYSIS? Technical analysis is an excellent method for analysing stocks and selecting the best ones. The following are some of the process's advantages...

FOREX PAIR: EURNZD PRICE CHART, ANALYSIS AND TRADING TIPS

Image
  EURNZD TECHNICAL ANALYSIS: WEEKLY CHART In the daily charts, EURNZD is trading in a down channel. EURNZD is currently trading above 20 and 50 days SMA & below 100 days SMA. RSI is in the selling zone which indicates bearishness. MACD is currently below zero which indicates bearishness. Its immediate support is 1.6336 & the resistance level is at 1.7017. EURNZD  will trade in the down channel until there is trend reversal . EURNZD TECHNICAL ANALYSIS: DAILY CHART CLICK HERE FOR FULL REPORT

STOCK MARKET: FORD MOTOR CO. PRICE CHART, ANALYSIS AND TRADE SIGNALS

Image
FORD MOTOR CO. TECHNICAL ANALYSIS: WEEKLY CHART In the weekly charts, FORD MOTOR CO. is trading in a down channel. FORD MOTOR CO. is currently trading below 20 and 50 days SMA & above 100 days SMA. RSI is in over sold zone which indicates mild bullishness. MACD is currently below zero which indicates bearishness. Its immediate support is 13.85 & the resistance level is at 15.49. FORD MOTOR CO. will trade in the down channel until there is trend reversal. FORD MOTOR CO. TECHNICAL ANALYSIS: DAILY CHART CLICK HERE FOR FULL REPORT

Commodity – Understanding Wheat Volatility & Food Security

Image
  On 08th March 2022, Chicago wheat futures soared to a record high of $13.634 a bushel, surpassing the high formed during the 2008 food crisis. The price of wheat had risen around 65% since the invasion of Ukraine by Russia on intensifying concern of supply disruptions. It has since then dropped about 24% as other circumstances arose. This fluctuation in wheat prices gives tremendous opportunities to traders and investors. Before making the most of this opportunity, we must first understand the basic but essential fundamental factors that influence wheat prices, enabling us to make informed trading and investing decisions. Brief Historical Background: ​ For generations, wheat has been one of the most critical food crops cultivated worldwide. There is evidence of wheat production beginning around 10,000 BCE and the Egyptians producing and baking bread over 5,000 years ago. Wheat today is the second most-consumed grain globally, trailing behind rice. In the farming community, wheat ...

NATURAL GAS PRICE & FORECAST BY CAPITAL STREET FX

Image
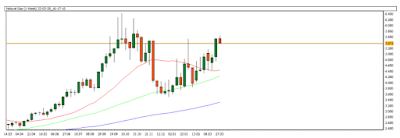
  In the weekly charts, Natural Gas is trading in an upward channel. Natural Gas is near its crucial support of 20-days SMA. If it breaks this support, it will possibly test the 50-days SMA level. Natural Gas will follow an uptrend in the coming weeks. The Natural Gas crucial support level is at 4.334 which is near 20 days SMA as of now. There are no signs of a bearish trend. Natural Gas is trading Above All the moving averages.RSI which is 60.40 Suggest Natural Gas  to move in  a Positive  Direction Bulls have their tight grip on Natural Gas. CLICK HERE FOR FULL REPORT

S&P 500 STOCK PRICE AND FORECAST BY CAPITAL STREET FX

Image
  S&P 500 PRICE TECHNICAL ANALYSIS: WEEKLY CHART In the weekly charts, S&P 500 is trading in a downward channel. S&P 500 is near its crucial support of 20-days SMA. If it breaks this support, it will possibly test the 50-days SMA level. S&P 500 will follow a downward trend in the coming weeks. The  S&P 500 crucial support level is at 4,584.90  S&P 500  which is near 20 days SMA as of now. There are no signs of a Bullish trend. Bears have their tight grip on  S&P 500. READ FULL REPORT - CLICK HERE