STOCK MARKET: SIEMENS AG PRICE CHART, ANALYSIS AND TRADING SIGNALS
.png)
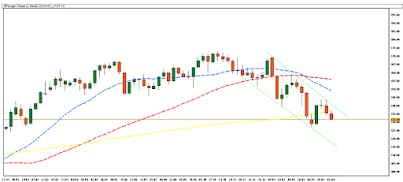
SIEMENS AG TECHNICAL ANALYSIS: WEEKLY CHART In the weekly charts, SIEMENS AG is trading in a down channel. SIEMENS AG is currently trading below all SMA. RSI is in selling zone which indicates bearishness. MACD is currently below zero which indicates bearishness. Its immediate support is 111.49 & the resistance level is at 125.05. SIEMENS AG will trade in the down channel until there is trend reversal. SIEMENS AG TECHNICAL ANALYSIS: DAILY CHART CLICK HERE FOR FULL REPORT
.png)
.png)
.png)
.png)

.png)
.png)
.png)


.png)


.jpg)