Posts

Showing posts with the label stock technical analysis

Disney Latest News And Technical Analysis - Capital Street FX

Image
  DISNEY BRINGS BACK BOB IGER AS CEO IN A BID TO BOOST GROWTH Bob Iger is returning to Walt Disney (NYSE: DIS) Co. as chief executive less than a year after he retired, a surprise comeback that coincides with the entertainment company’s attempt to boost investor confidence and profits at its streaming media unit. Iger, who retired last year after 15 years as chief executive, has agreed to serve as CEO for two more years effective immediately, Disney said in a statement late on Sunday. He will replace Bob Chapek, who took over as Disney CEO in February 2020, just as the COVID-19 pandemic hit, leading to parking closures and restrictions on visitors globally. Disney’s shares have fallen more than 40 percent so far this year, lagging the nearly 7 percent year-to-date drop in the broader Down Jones Industrial Average. “The Board has concluded that as Disney embarks on an increasingly complex period of industry transformation, Bob Iger is uniquely situated to lead the Company through th...

INDEX NEWS – NIKKEI 225 PRICE FORECAST &TECHNICAL ANALYSIS

Image
  JAPAN STOCKS LOWER AT CLOSE OF TRADE; NIKKEI 225 DOWN 1.68% Japan stocks were lower after the close on Friday, as losses in the Power, Railway & Bus and Precision Instruments sectors led shares lower. At the close in Tokyo, the Nikkei 225 declined 1.68%. The best performers of the session on the Nikkei 225 were Mitsubishi Motors Corp. (TYO:7211), which rose 18.01% or 94.00 points to trade at 616.00 at the close. Meanwhile, Konica Minolta, Inc. (TYO:4902) added 8.86% or 41.00 points to end at 504.00 and Mitsubishi Heavy Industries, Ltd. (TYO:7011) was up 4.41% or 227.00 points to 5,369.00 in late trade. The worst performers of the session were Z Holdings Corp (TYO:4689), which fell 14.18% or 56.20 points to trade at 340.00 at the close. AGC Inc (TYO:5201) declined 9.33% or 435.00 points to end at 4,225.00 and Nippon Suisan Kaisha, Ltd. (TYO:1332) was down 8.59% or 47.00 points to 500.00. Falling stocks outnumbered advancing ones on the Tokyo Stock Exchange by 2531 to 980 and ...

JP MORGAN CHASE PRICE ANALYSIS & TRADING TIPS - CAPITAL STREET FX

Image
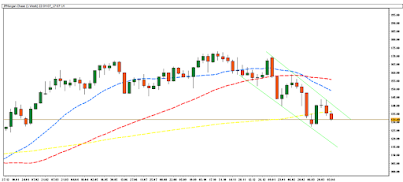
JP MORGAN CHASE TECHNICAL ANALYSIS: WEEKLY CHART In the weekly charts, JP MORGAN CHASE is trading in a down channel. It is trading below all SMA. The immediate support is 127.25 & the resistance level is at 139.62. JP MORGAN CHASE is trading in the down channel until there is trend reversal. JP MORGAN CHASE TECHNICAL ANALYSIS: DAILY CHART CLICK HERE FOR FULL REPORT

GENERAL MOTORS STOCK PRICE CHART AND FORECAST - TECHNICAL ANALYSIS BY CSFX

Image
  GENERAL MOTORS Technical Analysis: Weekly Chart In the weekly charts, GENERAL MOTORS was trading in the up channel. It is trading below 20 and 50 days SMA & above 100 days SMA. The immediate support is 44.09 & the resistance level is at 48.36. GENERAL MOTORS was trading in the up channel before the breakout. GENERAL MOTORS Technical Analysis: Daily Chart READ FULL REPORT - CLICK HERE